
1. Background
Since 2019, Pandora and SKIM collaborated to conduct tests prior to launching new product innovations.
The test is conducted in three key markets (United States, Italy and China) among a broad target group (18-64 y.o., Jewellery owners, Pandora non-rejectors). For self purchase occasion, only females are included, for gifting occasion, men are included as well (70% F / 30% M split). Please note that prior to 2023, the test was conducted in four key markets (United States, United Kingdom, Italy and China).
Every product is evaluated by around ~700 consumers per market. Global sample is weighted in accordance to 2021 sales share in the 4 markets. US, IT, CN sample is weighted in accordance to 2022 sales share in the 3 markets.
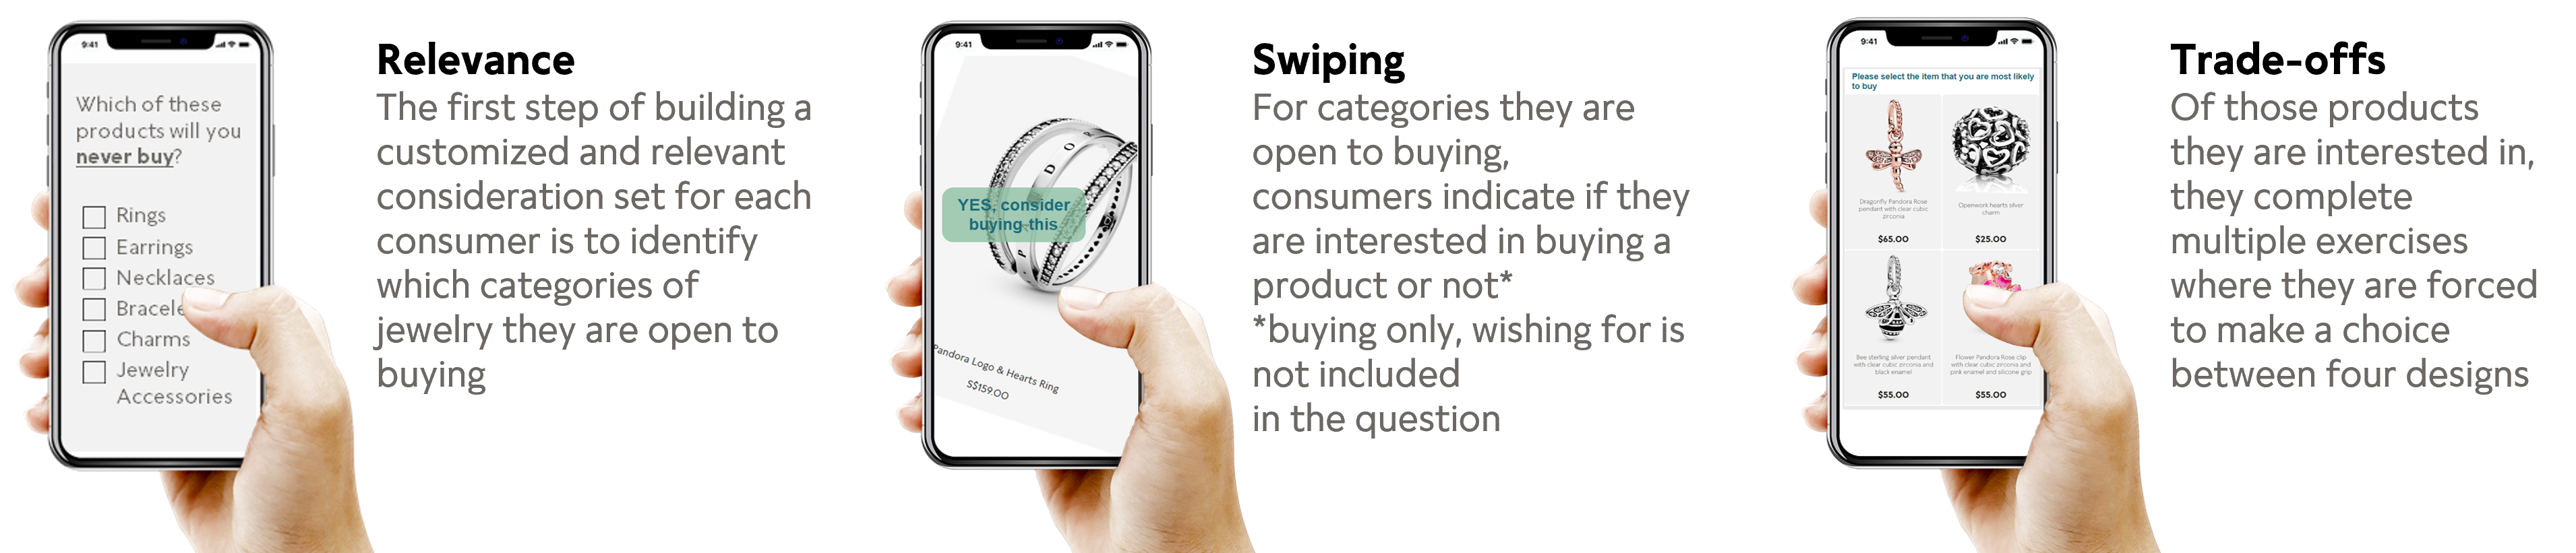
2. Product test methodology
Consumers indicate which categories they are open to buying.This ensures that they are shown only categories of jewelry relevant to them.
Based on swiping and trade-off exercises, a discrete choice simulation model is built for every test to calculate a performance score and run a TURF (reach) analysis.
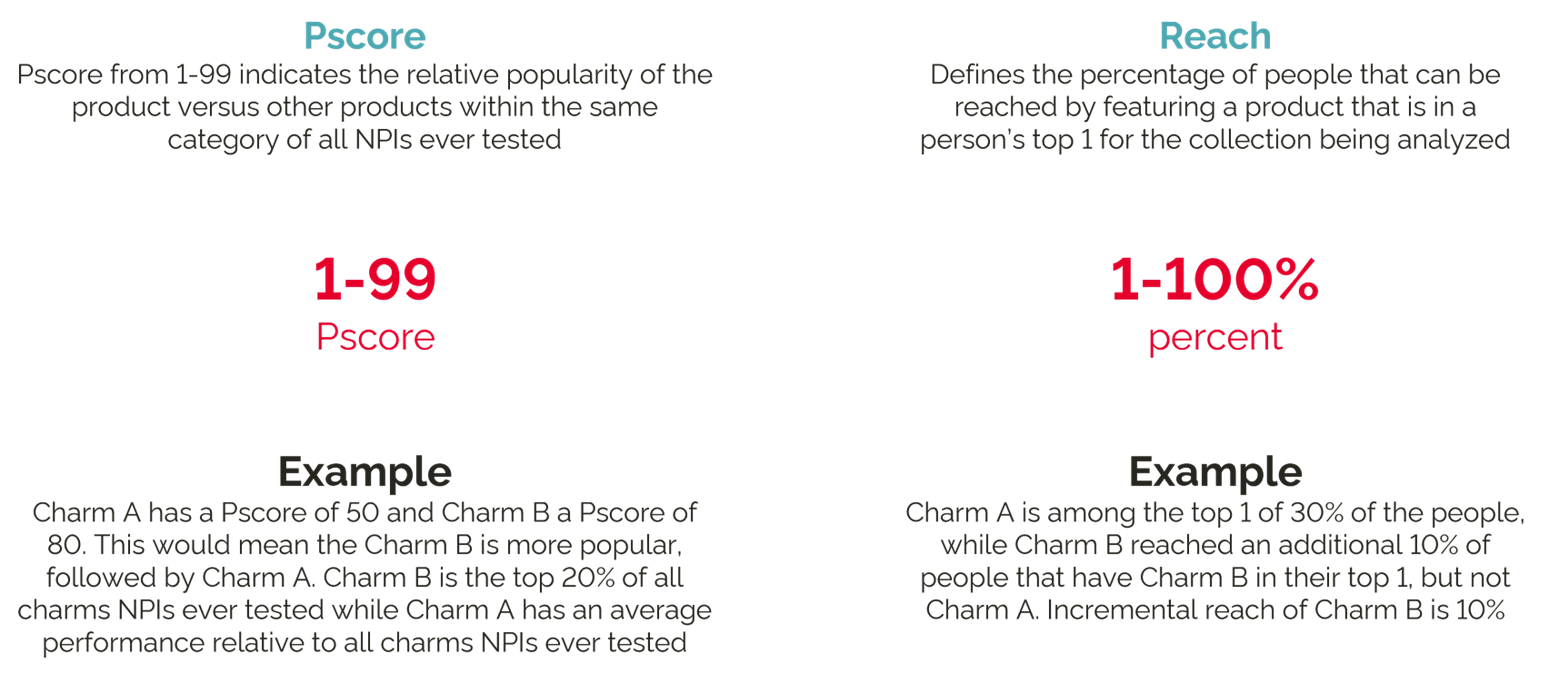
3. KPIs used for analysis
4. Overview of each tab
FAQ
List of frequently asked questions
Definitions
Definitions of all the product categories and variables in the database
Counter
Number of DV's that have been tested
Database
Overview of all DV's ever tested and compare DV's (up till 10 DV's). Possible to select all data to be shown in the database and download to excel (.csv file). When comparing DV's the cycle-specific base DV's used in actual test will be included as well. To search for a specific DV, you can type in the DV# or PDV# in the Search Table box to search all columns. Alternatively, you can select 'Customize Filter' and variable the DV# or PDV# and search for it in the drop down filter.
Cycle Specific Base / Direct Benchmark
Prior DV's tested of a similar design / collection to compare to the NPIs to give a better idea of the actual potential of the NPIs.
Top 25
Can be used to see the top 25 DV's ever tested. Use filter to look within category.
Last Test
Pscores (split by markets, categories and subgroups) for the latest Cycle tested.
What can this dashboard be used for?
As a catalogue, this houses a comprehensive database of all product test results, along with other appended information to aid classification, comparison, and analysis of DV Pscores.
Sorting capabilities plus pre-defined and custom filters help you find a DV/group of DVs.
How do I read and interpret the Pscores?
Pscore from 1-99 that indicates the relative popularity of the product versus other products within the same category of all NPIs ever tested. The higher the number, the better performing the NPI is relative to other products ever tested. Here are some things to note:
Where do I find the latest cycle's results?
Use the menu above to navigate the sections of this dashboard. The latest results are under 'Last Test'.
How do I search for a DV?
At the 'Database' page, there are two ways you can search for a DV. You can either type in the DV# or PDV# in the 'Search Table' box or select 'Customize Filter' and select either the DV# or PDV# and search for it in the drop down filter.
How do I use the Search Table function?
The 'Search Table' function is able to search through all columns, but note that if you do a search of two words, it must be written consecutively as it is for example, in the description.
Am I able to customize what I see in the database view?
Yes. While there is a default view, you can select the variables you want to see on the page using a drop-down menu under 'Customize Table'.
How do I make a comparison between the main DV and other designs?
Make your selections on the main database view by clicking on the DV entries (rows) of interest. Once highlighted, click the 'Select Comparisons' filter at the top and select from the dropdown 'Start comparing' . A pop-up will appear where you can assign one of the DVs as your main product. All the rest will be used as comparison DVs. Pre-defined comparisons will also appear alongside your chosen comparisons.
How do I navigate the comparison view?
The first image from the left is the main DV, followed by the comparison DVs (both pre-defined or user-chosen). These can be de-selected using the tick box, to focus only on DVs of interest. There is also a comparison of Pscores (global and across the four markets), with color-coding to indicate significantly different Pscores from average (orange is lower than average and blue is higher than average)
A histogram visualization shows relative DV performance, where the black line indicates where the design falls versus other designs within the filters applied. Use the 'Close' button to hide this view and return to the main database tables.
Will I be able to export or view the data I run on this dashboard outside of it?
All data from the database can be exported and downloaded to an excel spreadsheet format. You can choose to download the data with the DV image or without for filtered datasets. For larger unfiltered datasets, it is only possible to download using the 'No imgs' download option.
I lost my password?
You can reset your password by clicking 'forgot my password' on the login page.
To toggle between US, IT, CN (3 countries) scores and global scores including UK, you can use the Pscores filter located on the left.
Top 25 NPIs
of all NPIs ever tested
Black vertical line and X% = The performance of this DV is at the X% of all DVs filtered using the left sidebar filters (which forms the basis of comparison).
To get the most relevant comparison, you can make adjustments to the sidebar filters.
If no black line appears, the base of comparison is not valid as the characteristics do not correspond to the DVs being compared